Wednesday, August 30, 2017
canadian charts suggest positive gdp
Most Important News In Notepad on Thursday August 31 is the gross domestic product of the Canadian dollar, where analysts expect that the 0.1% lower than the previous month, 0.6%
if we look at the various Canadian dollar pairs inspiring US trends COLLIDED could not be broken, indicating positively Canadian GDP here each pair and trend collided with
usdcad on the daily time frame reached the summit today at the level of 1.2619 candle clashing daily trend depend on the peaks of days 5 May 2017 ,18 May 6-1, 7-5, 4-6, 6-3 June June June June 23 quarters 11-16 August

eurcad reached the summit of Today at 1.5040COLLIDING trend is based on two summits on June 5 and June 8 Candle Yesterday August 29 tried to break this trend but closed below

gbpcad, we find that the weekly CANDLE hit trend based on weekly summits May 22 2016, 19 June 2016, July 16, 2017 CANDLE CANDLE 16 April 2017 succeeded in breaking the الترند but returned in price candle 2July closing below then tried to several candles to break this trend surpassed candle July 30, but in the end, the CANDLE closed below Week

cadchf four hours we will find, during the landing of the husband upward trend collided by candlelight collided days 19 June 12 July, August 29 since July 12 and the price moves above even when exceeded the price on August 29 and quickly rose candles The price returned to move aggressively above we find that the CANDLE of the Day August 30 also touched ricocheted up

euro close below 161.8% of quarterly fibbonacci
the euro rise for 29 august stop at 1.2069 below the second resistance of weekly pivot b four points
 and the top of the day was at the half of the day exactly and the second twelve hours were descending, to make daily candle close as shooting star,it is not the typical shooting star but it is close yo it very much.
and the daily candle close below 161.8% of the qurterly fibbonacci which represent april,may,june months,at 1.1985
 and the 161.8% level is very important and market respect it and the price should go down to 150% level at 1.1882 and let 's see what will happen

and the daily candle close below 161.8% of the qurterly fibbonacci which represent april,may,june months,at 1.1985

Wednesday, August 23, 2017
eur nzd hit half yearly pivot and return
euro rose Massey today strongly because the euro and the weakness of the dollar gained strength because of statements by the Trump hostilities against the Nafta to the possibility of taking the decision of closure of the government expenditure on the fence, which wants to build on the border between him and Mexico because of the cheaper Mexican labor kidnaps employment of unemployed Americans. On the other side there is an important statistical awaited for nzd, namely the trade balance which analysts expected to come -200 $NZ460 million while the previous month, 242 million, expect a very negative make nzd falls strongly.
Let our fundamental analysis to technical analysis, we find that the euro New Zealandcollided today during the rising level of the resistance forces of First half-year pivot of 1.6365 and closed at 1.6336 level candle feedback 20 points below the level of resistance.

Let our fundamental analysis to technical analysis, we find that the euro New Zealandcollided today during the rising level of the resistance forces of First half-year pivot of 1.6365 and closed at 1.6336 level candle feedback 20 points below the level of resistance.

is the bullish trend on eur gbp over?
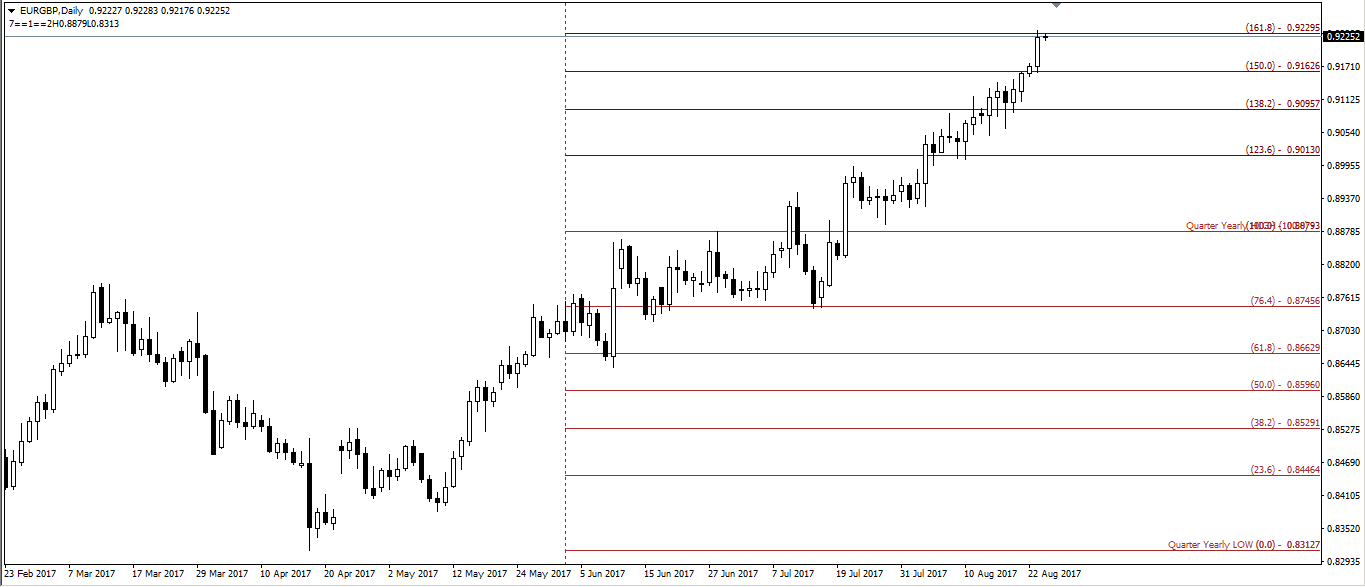
Euro pound collided on the level of 161.8% of the quarterly and half-year fibonacci of 0.9229 and closed on the bottom of the candle at the level of 0.9222
and equal to the previous quarter of the year 2017, which represents the months of June and May and April in levels of fibonacci from the June top and the bottom of the April with data with the first half of the year because the June summit of the top of the summit of the first quarter and seabed April less than the first quarter
and therefore when we draw a Wave Fibonacci ratios between June top at the level of 0.8879 and bottom of April at the level of 0.8312, we find that the level of 0.9229 represents a 161.8% Fibonacci who stopped historical trends on different currency pairs .
. other hand, we find that a summit on 23 August, less than 0.9235 The great psychological figure 0.9250five points and less from the summit of 7 October 2016, which amounted to 0.9306 by 70 pips
therefore, we now stand at 161.8% Fibonacci level and near the No. myself and near the extraordinary summit of the abrupt wear to the market.points the summit created because of the sudden drop of the cable in Asian period
 ,
,
and equal to the previous quarter of the year 2017, which represents the months of June and May and April in levels of fibonacci from the June top and the bottom of the April with data with the first half of the year because the June summit of the top of the summit of the first quarter and seabed April less than the first quarter
and therefore when we draw a Wave Fibonacci ratios between June top at the level of 0.8879 and bottom of April at the level of 0.8312, we find that the level of 0.9229 represents a 161.8% Fibonacci who stopped historical trends on different currency pairs .
. other hand, we find that a summit on 23 August, less than 0.9235 The great psychological figure 0.9250five points and less from the summit of 7 October 2016, which amounted to 0.9306 by 70 pips
therefore, we now stand at 161.8% Fibonacci level and near the No. myself and near the extraordinary summit of the abrupt wear to the market.points the summit created because of the sudden drop of the cable in Asian period
Friday, August 18, 2017
Negative signals dominate the Canadian charts Before Inflation News Retail Sales
shortly after we have a package of important news on the Canadian dollar where we have inflation and retail sales price was accompanied by violent movement
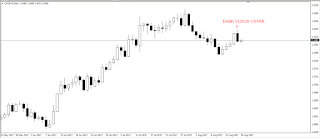
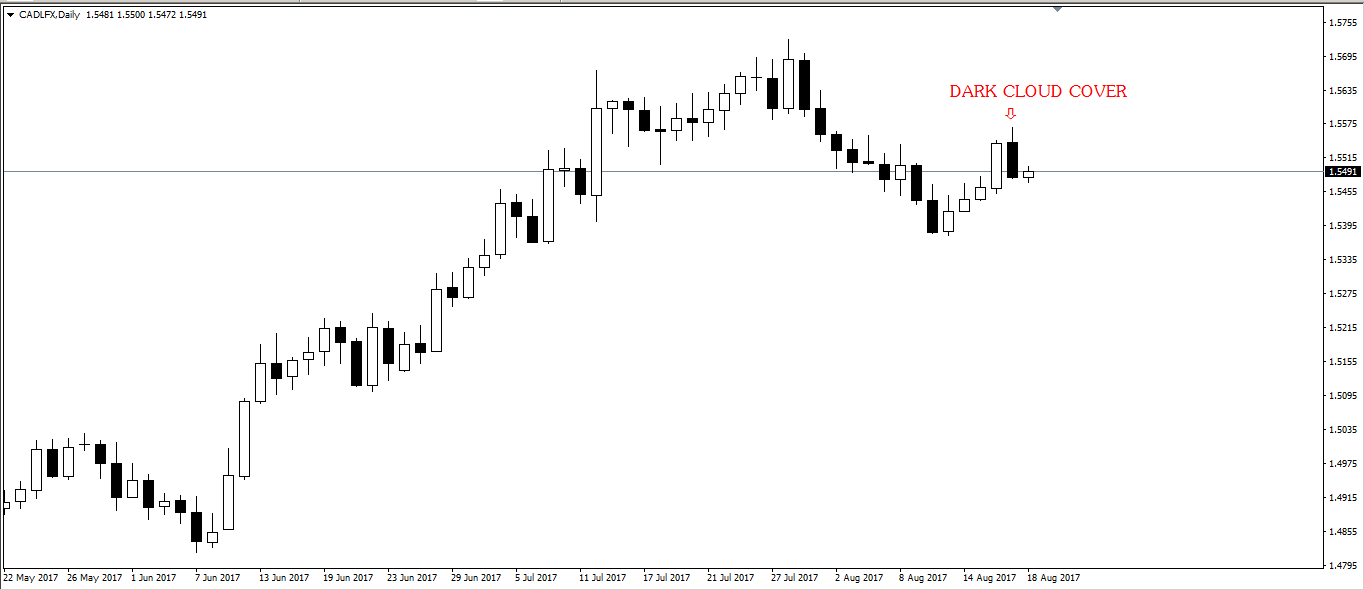
when look Canadian chart index, we find that the CANDLE yesterday, a candle too negative and of the reflective signals called cloud cover the dark,
DARK CLOUD COVER
 when we look at the eurcad CHARTING is, we find that the CANDLE yesterday were very positive CANDLE hammer escalated after the touched level of 61.8% of the Fibonacci progression between the bottom of the fan on July 20 at the level of 1.4476 and summit on Aug. 11 at the level of 1.5015

when we look at the chart gbpcad at hour time frame, we will find that the form of the REFLEXIVE may be only a rising sharks,warning to ascend.

Finally, the weekly first photo nzdcad will find that the tail of the CANDLE the previous week nestled in a historic support region hit by several other Candles, candles and Ricocheted succeeded inside or bottom, we find that the following candles rose up affected by strong support area.
If the inflation news and negative retail sales will support the negative signals that appeared on the Canadian dollar.

when look Canadian chart index, we find that the CANDLE yesterday, a candle too negative and of the reflective signals called cloud cover the dark,
DARK CLOUD COVER

when we look at the chart gbpcad at hour time frame, we will find that the form of the REFLEXIVE may be only a rising sharks,warning to ascend.

Finally, the weekly first photo nzdcad will find that the tail of the CANDLE the previous week nestled in a historic support region hit by several other Candles, candles and Ricocheted succeeded inside or bottom, we find that the following candles rose up affected by strong support area.
If the inflation news and negative retail sales will support the negative signals that appeared on the Canadian dollar.

Wednesday, August 16, 2017
The Australian dollar pairs suggest negative employment news failing to penetrate the important resistance levels
despite the great rise of the Australian dollar against various currencies but they all failed to overcome significant resistance levels, suggesting negative employment news news .
The Australian dollar index hit a trend based on a top on July 27 at the level of 1.5677 and top on Aug. 1 at the level of 1.5655 and hit the daily Candle at the level of 1.5556 and closed at 1.5542 level recorded 14 points return.
 Australian pair closed at the lowest level of 0.7922 simple daily moving average of $0.7926.

the daily falling Limousine candle of eur aud could not break the line of marabuzo line of latest rising limousine daily candle of June 27 , where the candle closed at the level 1.48448 , while اmarabuzo line, which represents 50% of the body of the candle at1.48425 level, could not price closed below it.
 .
.
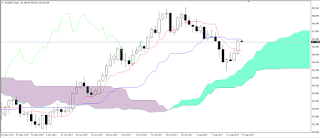
Finally, the Australian pair yen which hit the daily kjun level of ichimoko kinko haiou .
Thus, the failure of the four pairs of Australian dollar exceeded the mentioned resistance levels suggest negative employment news.
The Australian dollar index hit a trend based on a top on July 27 at the level of 1.5677 and top on Aug. 1 at the level of 1.5655 and hit the daily Candle at the level of 1.5556 and closed at 1.5542 level recorded 14 points return.


the daily falling Limousine candle of eur aud could not break the line of marabuzo line of latest rising limousine daily candle of June 27 , where the candle closed at the level 1.48448 , while اmarabuzo line, which represents 50% of the body of the candle at1.48425 level, could not price closed below it.

Finally, the Australian pair yen which hit the daily kjun level of ichimoko kinko haiou .

Thus, the failure of the four pairs of Australian dollar exceeded the mentioned resistance levels suggest negative employment news.
Tuesday, August 15, 2017
Daily closure of gbpusd gives positive signals for unemployment today
despite the violent landing of cable because of the negative inflation news, as the index of consumer prices was -0.1%, lower than the 0.0% expected analysts, and is of the same value as the previous month, the consumer price index also came annually at 2.4%, less than analysts expected at 2.5%, but like the previous month, and on the other side the US retail sales for the month of July, positive, 0.6%, better than analysts expected at 0.4%, better than the previous month, which reached 0.3%.
But the daily CANDLE closed the cable in a positive way, where once touching the price of the 61.8% of the fibonacci retracement between 3 August top at the level of 1.3267 and June 21 bottom at the level of 1.2588, we will notice that the price respect the level of 61.8% of 1.2847 ,reverse from it,price has been unable to close an hourly candle below this level and the dialy candle close over this level by21 points at 1.2868.


As well as find the Gartley model appear predicting price ascending and breaking the 3 August top .

Today we have British unemployment news which, if positive, will support market respect for trend and support gartley model.
Sunday, August 13, 2017
GBP CHF REVERSE FROM FIBONACCI CLUSTER AREA
GBP CHF arrived on Friday 11 August to FIBONACCI cluster area where price reached to the area of 61.8% of the Fibonacci Retracement between the top on August 3 at the level of 1.2852 and bottom on June 12 at the level of 1.2239 and surpassed that reached the level of 50 % of the Finonacci Expansion between the May 10 top at the level of 1.3067 and bottom on June 12 at the level of 1.2239 and top on Aug. 3 at the level of 1.2852 once touching the price level of 50% of $1.2438 price rebounded and continued to climb the highest level of 61.8% of the Fibonacci retracement and closed in the form of a Hammer ominous ascend the coming days.
Trend often ends when it reach for the Fibonacci cluster area.
 And the weekly candle touched Trend which based on the bottom of the candle, 11 June and 18 June and 25 June and 9 July, when the Trend penetrated by the candle July 16,
, price returned strongly the following week over the Trend and created rising limousine CANDLE. of week July 23 ,the weekly candle touched that Trend at tthe level of 1.2423 and closed at 1.2507 ,so the price reverse upwards with initially 77 pips, which shows market respect for that Trend.

When we look at the tail of the weekly candle, where the candle closed at 1.2507 and bottom at 1.2423 when we find this region represents a very strong support region ,price hit it then went up several times like the week of July 3, 2016and 14 August 2016and candle September 25, 2016, 25 December 2016, and at times exceeded the area returned to go upwards.

Trend often ends when it reach for the Fibonacci cluster area.

, price returned strongly the following week over the Trend and created rising limousine CANDLE. of week July 23 ,the weekly candle touched that Trend at tthe level of 1.2423 and closed at 1.2507 ,so the price reverse upwards with initially 77 pips, which shows market respect for that Trend.

When we look at the tail of the weekly candle, where the candle closed at 1.2507 and bottom at 1.2423 when we find this region represents a very strong support region ,price hit it then went up several times like the week of July 3, 2016and 14 August 2016and candle September 25, 2016, 25 December 2016, and at times exceeded the area returned to go upwards.

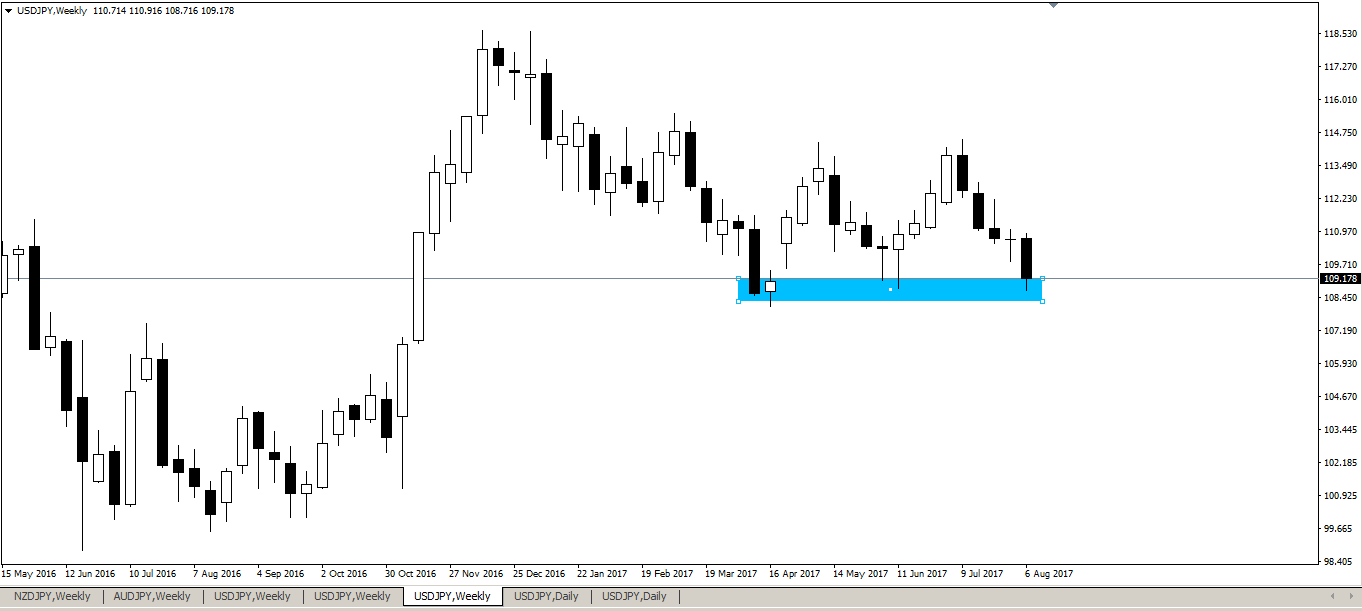
IS USD JPY DOWN TREND IS OVER ?
The Chart of the dollar yen fell 200 points in the last week, and closed at 109.17 , when we look at the lower tail, we will find support zone that several candles tried to break it ,Like a candle June 11, 2017 rising Hummer and before that candle, June 4, 2017 Hanging man candle and candle Week 9 April 2017 had already been closed inside the support zone, but candle 16 April were rising upward trend started to do with the arrival of the price will decline for the support as repeated three times before
 we find also that the last week candle hit Trend is based on the bottom of the September 25, 2016 at the level of 100.08, bottom 6 November 2016 at the level of 101.18 and reverse up with 46 points from touching the Trend.
 Weekly closure at the level of 109.17 other significance, close above level of Marabuso line, which represents 50% of the limousine candle-rising body extends to 413 points for week 16 November 2016 and this Marabuso line is located at the level of 108.81
 when we turn to the time-frame we find daily reversal model may be only and is AB=CD


Subscribe to:
Posts (Atom)