After less than an hour from now we have Australian Unemployment news
which I will try to predict price action at the time of the news based
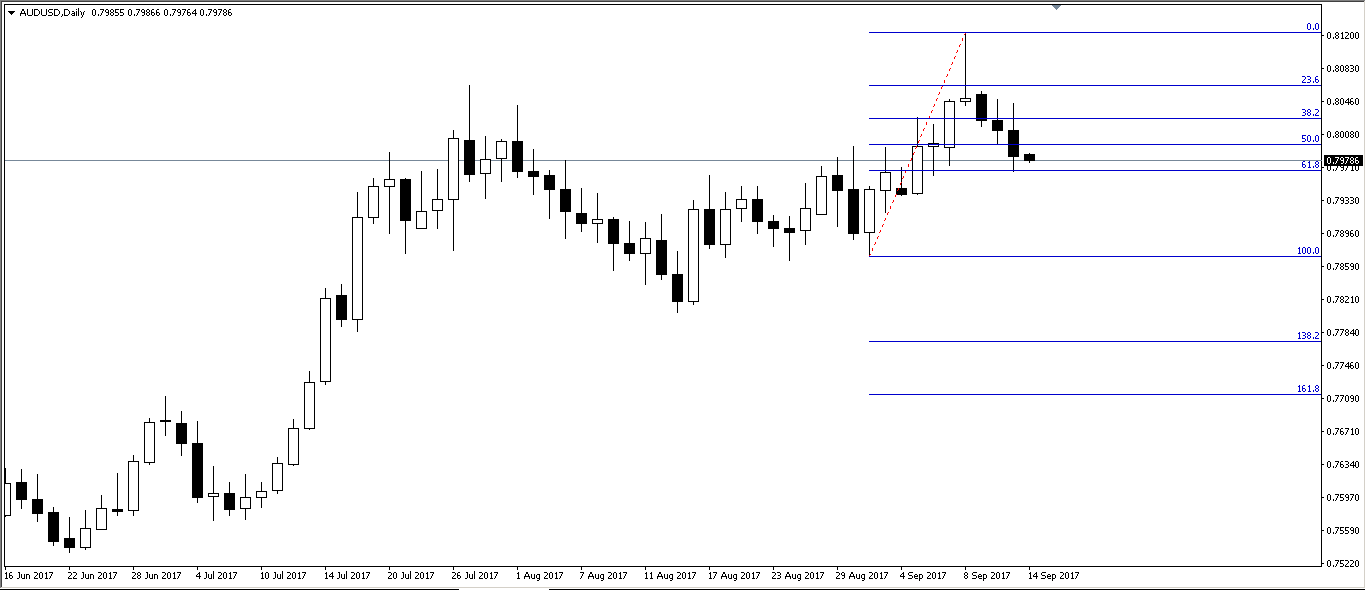
on the daily closing of the different AUD pairsThe AUDUSD pair closed above the 61.8 Fibonacci level extending
between the August 31 low and the September 8 high and the pair's
rejection of this level suggests a rebound on the next day, signaling
the Australian dollar to rise today and thus positive unemployment newsLooking
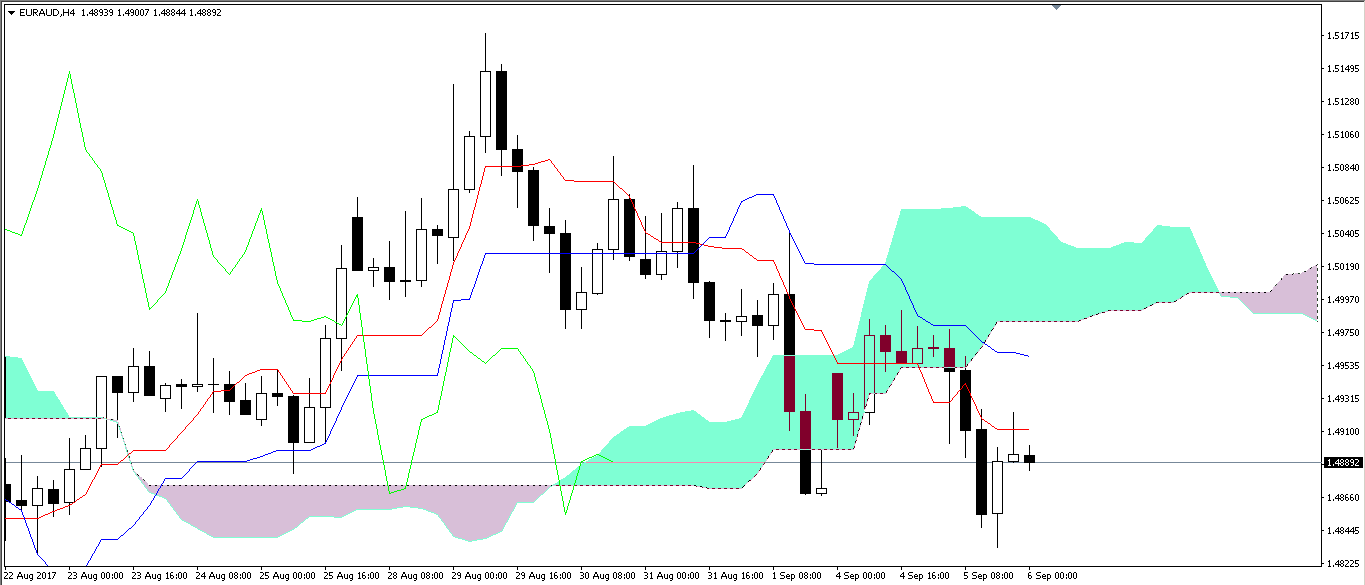
at the EUR / AUD chart, the daily closing was below the 61.8% Fibonacci
level extending between the August 17th low and the August 29th high,
suggesting a fall of 61.8%, but this is the fifth day closing the lowest
level suggesting That the rebound is only a correction, and that the delay is finally fallingThe Australian dollar also closed the highest level of 61.8% of the
Fibonacci levels of the month of August between the bottom and the
summit of AugustAustralian
Yen The hourly candlestick managed to close the 138.2% high of the
quarterly Fibonacci, signaling a third-quarter closing as high as the
price was in July and the August drop was just a correction
prediction of important news on the economic calendar,analysis of price action,daily close,free signals
Wednesday, September 13, 2017
Tuesday, September 12, 2017
British unemployment news expected today
Despite the
large rise of the pound against all currencies due to positive inflation
news, but found that the daily closing of three pairs of pairs of cable
failed to close the top 38.2% of the fan of the Fibonacci and find that
the three pairs touched the fan, but bounced back and closed down and
is expected to be negative unemployment news In
order to drop the pound and the correction of the fan and the pairs are
the Euro Pound, the Pound Sterling and the Canadian Pound
Friday, September 8, 2017
is the uptrend on euro over?
Despite the positive of Draghi's speeches yesterday, which pushed the
euro to close yesterday for the first time above the psychological
figure 1.2 and continued to rise today to break the annual summit and
the summit of Jadida at 1.2091But today the fundamental analysis and technical analysis provide several indicators of the beginning of the decline of the euroBasic AnalysisFirst,
we announce today the date of the referendum on the secession of
Catalonia from Spain on October 1. We know that any problem in any euro
country affects the euro very strongly. We remember the problems of
Greece, Portugal, and Cyprus. What is Spain, which is considered one of
the great powers of the euro? This secession will lead to losses in Spain's gross domestic product
as well as a deficit in the Spanish trade balance. The Catalan region
represents 26% of Spain's exports plus its tourist superiority over
Madrid. The most dangerous of all is that the referendum on secession is
repeated in other countries.Second, we have September 23 parliamentary elections in Germany but
Angela Merkel's party is dominant in the polls and there is great
confidence that the political situation in Germany will not change.Third: France's Minister of Commerce complained about the appreciation of the euro and the negative impact on exports
Technical AnalysisThe Euro hit today with a very important pivotal level, the second resistance level of the classical classical pepot, which is 1.2193 before touching that level which stopped at 1.2091 and started to end the day in the shape of the inverted hammer, which is a reflection pattern. Days is the candle Shoteng Star at the top close to the top of the day at 1.2069 and thus repeat two models reflective over the course of 9 days a dangerous warning by the end of the rising trend
usd index which hit today as it fell with the moving average 300 on the weekly 90.98 and the day's low at 0.91. Before the two-point crash,
the dollar started to rebound and closed the day's candlestick pattern.
Technical AnalysisThe Euro hit today with a very important pivotal level, the second resistance level of the classical classical pepot, which is 1.2193 before touching that level which stopped at 1.2091 and started to end the day in the shape of the inverted hammer, which is a reflection pattern. Days is the candle Shoteng Star at the top close to the top of the day at 1.2069 and thus repeat two models reflective over the course of 9 days a dangerous warning by the end of the rising trend
usd index which hit today as it fell with the moving average 300 on the weekly 90.98 and the day's low at 0.91. Before the two-point crash,
the dollar started to rebound and closed the day's candlestick pattern.
Tuesday, September 5, 2017
australian pairs charts suggest positive gdp
after one hour from now we have australian gdp which i predict to be positive because charts gave us such signs when we look at aud usd we will find that there is one hour candle close above weekly pivot first resistance and at 0.8019 ,which means above 0.8 psychological level and four hours candle close at 0.8008
eur aud the las 4 hours candle is the inverted hammer which is a negative sign beside it touched the tanakan line but it coul not close above it
Friday, September 1, 2017
usd charts show negative nfp
regardless of the positive closures of all exchange yesterday in front of the US dollar against the euro, we find in the form of reasoned closed hammer pound, which was closed for the third time in four days in the form of a hammer, as well as the fact that we have the Kiwi man mashnouq واللونى candle the CANDLE the dark cloud cover.
We find also signs appeared today to chart the euro as the price daily البيفوت and opened the highest price approached kitsch touching level of البيفوت daily classic but was unable to close the bottom of the wax hour.
We find it repeated with Australian price approached twice on two hour consecutive classic البيفوت norodam daily and
the Swiss franc rose ricocheted before TOUCHING البيفوت today
found that gold yesterday during landing بترند collided on four hours upward coming from July 10 and hit by candlelight vigil on July 11 and August 23 twice and could not broken when it was broken on 24 اسطس quickly returned the price on August 25 with a hammer to complete the path the highest الترند
also find during the Rise of the dollar yesterday before the South African rand and collided with the بترند curve coming from on Aug. 4 Try price over three days exceeded but to no avail and
finally when we look at the chart on the weekly time frame kiwi find that collided with the Yesterday بترند upward trend based on the bottom of the September 20, 2015 and January 10, 2016
Wednesday, August 30, 2017
canadian charts suggest positive gdp
Most Important News In Notepad on Thursday August 31 is the gross domestic product of the Canadian dollar, where analysts expect that the 0.1% lower than the previous month, 0.6%
if we look at the various Canadian dollar pairs inspiring US trends COLLIDED could not be broken, indicating positively Canadian GDP here each pair and trend collided with
usdcad on the daily time frame reached the summit today at the level of 1.2619 candle clashing daily trend depend on the peaks of days 5 May 2017 ,18 May 6-1, 7-5, 4-6, 6-3 June June June June 23 quarters 11-16 August
eurcad reached the summit of Today at 1.5040COLLIDING trend is based on two summits on June 5 and June 8 Candle Yesterday August 29 tried to break this trend but closed below
gbpcad, we find that the weekly CANDLE hit trend based on weekly summits May 22 2016, 19 June 2016, July 16, 2017 CANDLE CANDLE 16 April 2017 succeeded in breaking the الترند but returned in price candle 2July closing below then tried to several candles to break this trend surpassed candle July 30, but in the end, the CANDLE closed below Week
cadchf four hours we will find, during the landing of the husband upward trend collided by candlelight collided days 19 June 12 July, August 29 since July 12 and the price moves above even when exceeded the price on August 29 and quickly rose candles The price returned to move aggressively above we find that the CANDLE of the Day August 30 also touched ricocheted up
if we look at the various Canadian dollar pairs inspiring US trends COLLIDED could not be broken, indicating positively Canadian GDP here each pair and trend collided with
usdcad on the daily time frame reached the summit today at the level of 1.2619 candle clashing daily trend depend on the peaks of days 5 May 2017 ,18 May 6-1, 7-5, 4-6, 6-3 June June June June 23 quarters 11-16 August
eurcad reached the summit of Today at 1.5040COLLIDING trend is based on two summits on June 5 and June 8 Candle Yesterday August 29 tried to break this trend but closed below
gbpcad, we find that the weekly CANDLE hit trend based on weekly summits May 22 2016, 19 June 2016, July 16, 2017 CANDLE CANDLE 16 April 2017 succeeded in breaking the الترند but returned in price candle 2July closing below then tried to several candles to break this trend surpassed candle July 30, but in the end, the CANDLE closed below Week
cadchf four hours we will find, during the landing of the husband upward trend collided by candlelight collided days 19 June 12 July, August 29 since July 12 and the price moves above even when exceeded the price on August 29 and quickly rose candles The price returned to move aggressively above we find that the CANDLE of the Day August 30 also touched ricocheted up
Subscribe to:
Posts (Atom)