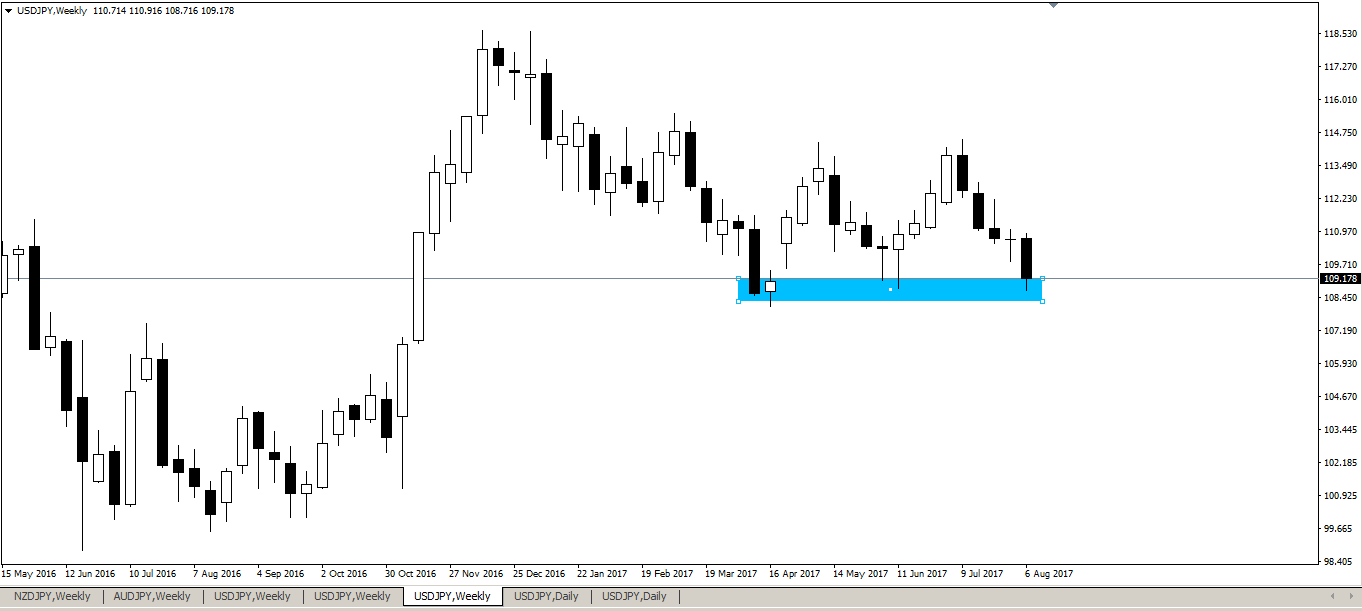
The Chart of the dollar yen fell 200 points in the last week, and closed at 109.17 , when we look at the lower tail, we will find support zone that several candles tried to break it ,Like a candle June 11, 2017 rising Hummer and before that candle, June 4, 2017 Hanging man candle and candle Week 9 April 2017 had already been closed inside the support zone, but candle 16 April were rising upward trend started to do with the arrival of the price will decline for the support as repeated three times before
 we find also that the last week candle hit Trend is based on the bottom of the September 25, 2016 at the level of 100.08, bottom 6 November 2016 at the level of 101.18 and reverse up with 46 points from touching the Trend.
 Weekly closure at the level of 109.17 other significance, close above level of Marabuso line, which represents 50% of the limousine candle-rising body extends to 413 points for week 16 November 2016 and this Marabuso line is located at the level of 108.81
 when we turn to the time-frame we find daily reversal model may be only and is AB=CD


No comments:
Post a Comment